
AI and Privacy Education for Adolescents
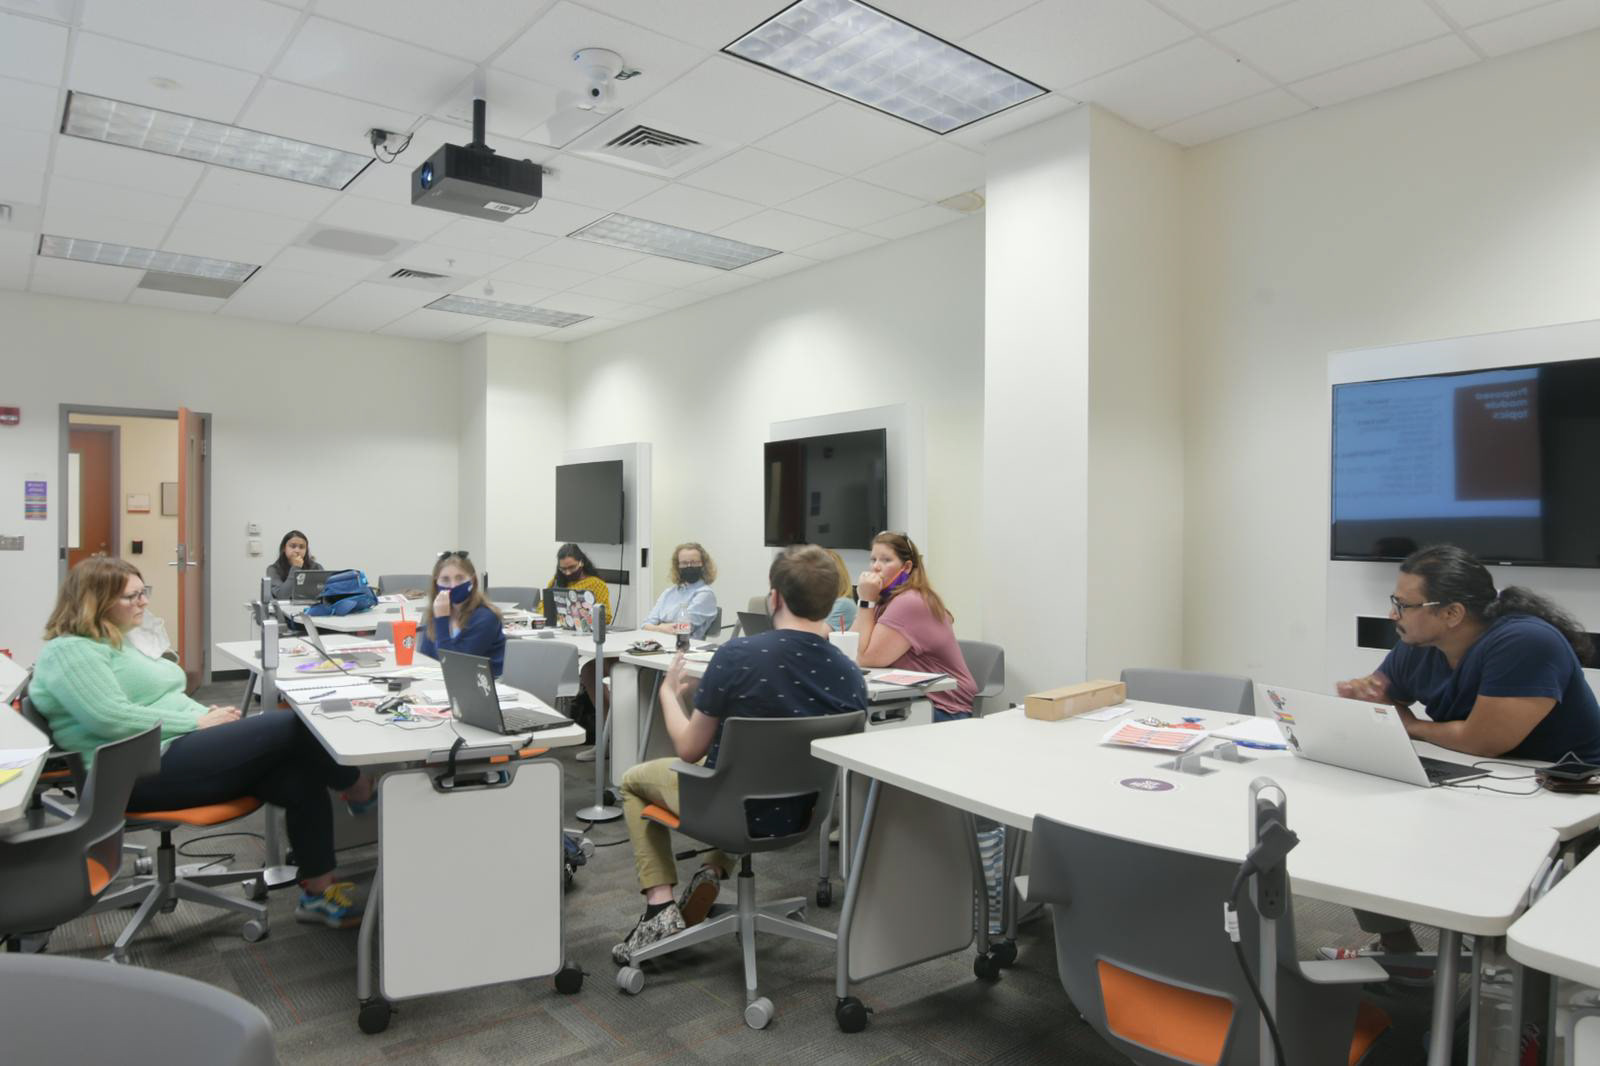
Participatory design session

In this project we aim to identify middle school students AI and privacy learning needs and develop education intervention in collaboration with middle school teachers and long-term goal of integrating these interventions within the existing K-12 curricula. Our efforts are informed by students and teachers needs', deliver much needed AI and privacy education to classrooms, and provide adequate teaching and learning resources to the teachers.I designed and conducted semi-structured interviews with 17 middle school students to identify their learning needs, designed learning and teaching materials in collaboration with the teachers, and conducted classroom interventions to evaluate modules' contribution to students' learning.
Inclusive Recommender Systems
This study evaluates whether recommender systems are inclusive of the unique needs of users' with ADHD. I use User-Centered Design where I conducted usability, co-design, and design critique sessions with 6 participants respectively. The inclusive recommender system designs are informed by neurodivergent users. With the increasing use of commercial LLMs like ChatGPT in user studies in the HCI scholarship, concerns about the safety of participants are pertinent. We intend to uncover researchers perspective and practices towards protecting participant data and identify their needs to ensure safekeeping of participants data.
Recommender System for Self Actualization
(NSF Career grant # 2045153)
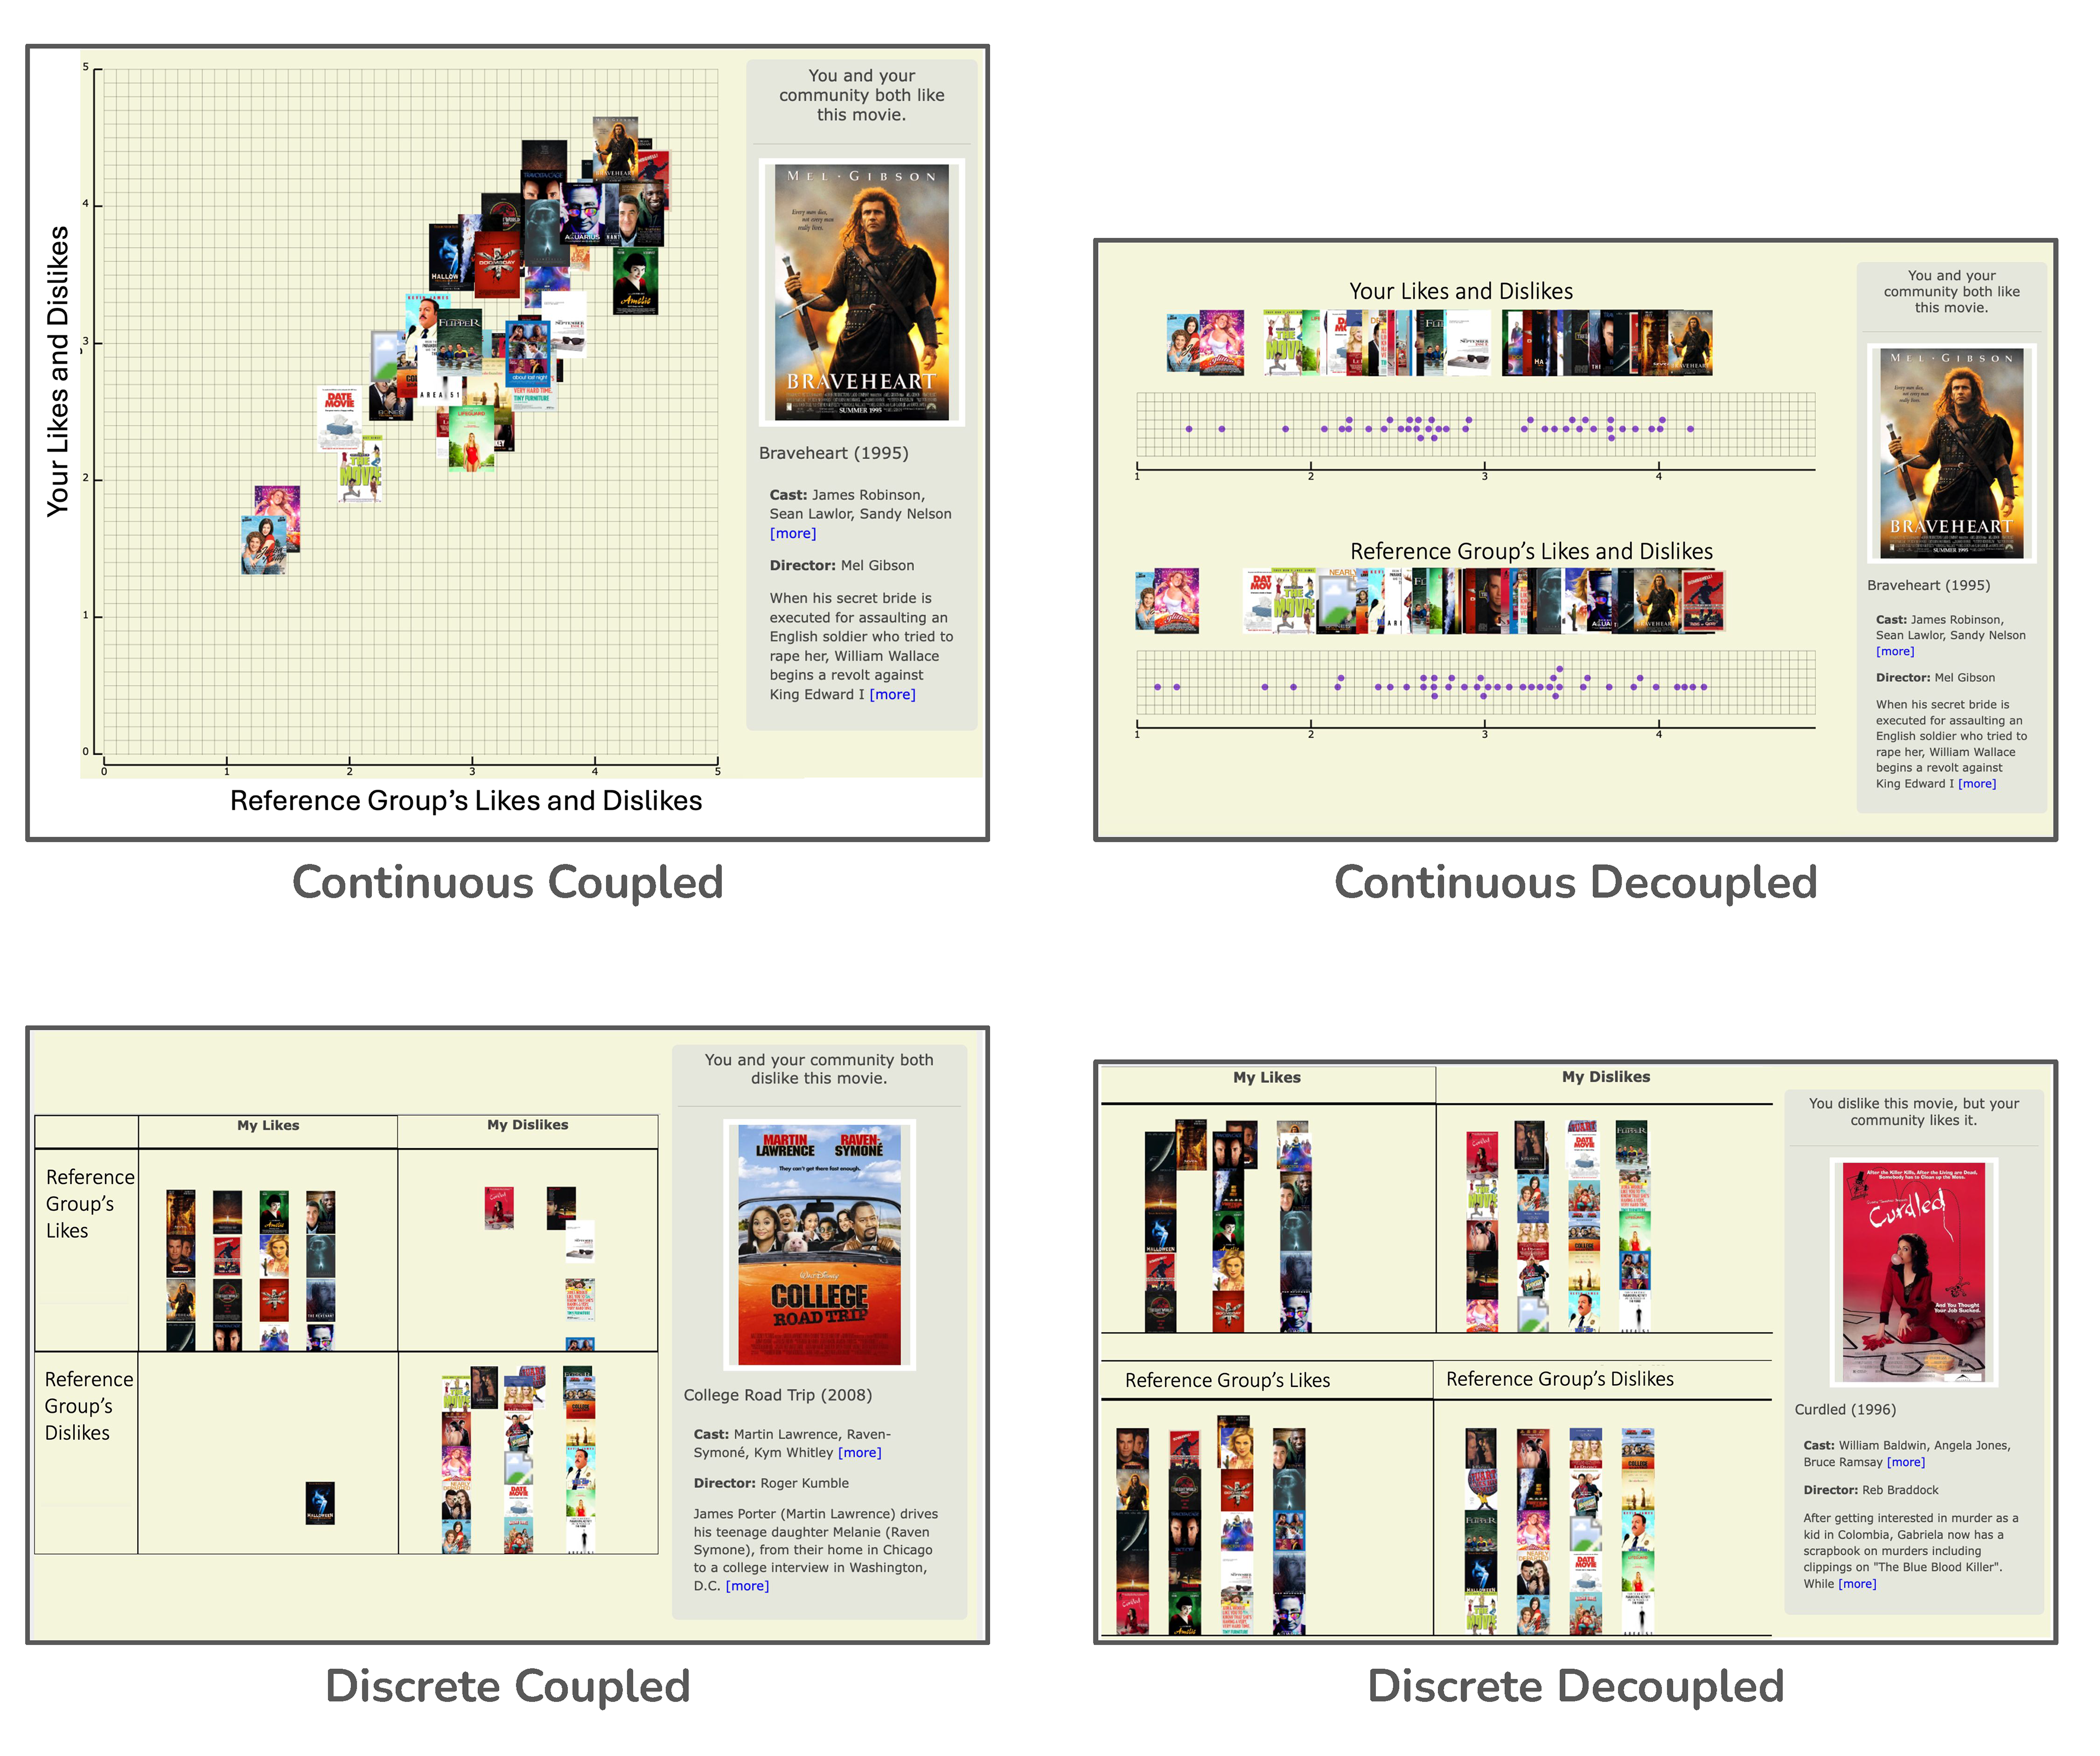
This study aims to help users explore, develop, and understand their preferences based on their long term goal in an effort to elicit preferences beyond their filter bubbles. To support users develop their unique preferences, we visualize users' preferences respective to their K-nearest neighbors. We conduct a between subjects study to evaluate 4 different kinds of visualization and their potential for preference development. I designed and developed interactive personalized preference visualizations (mock-ups in Figma, development in JS using react), survey and the study setup. These visualizations should help users identify the common and unique sides of their personalities.
Privacy Education for Older Adults
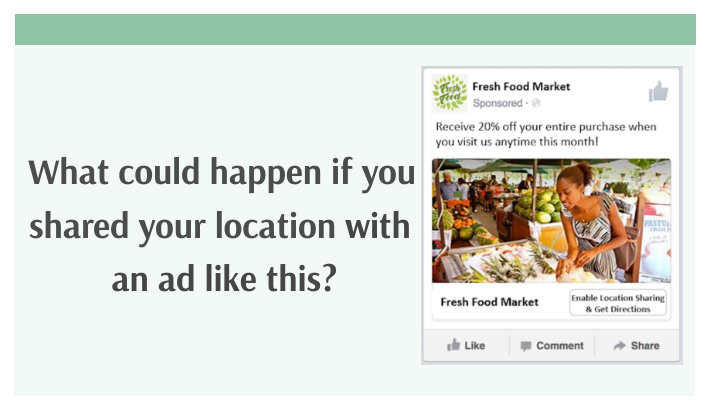
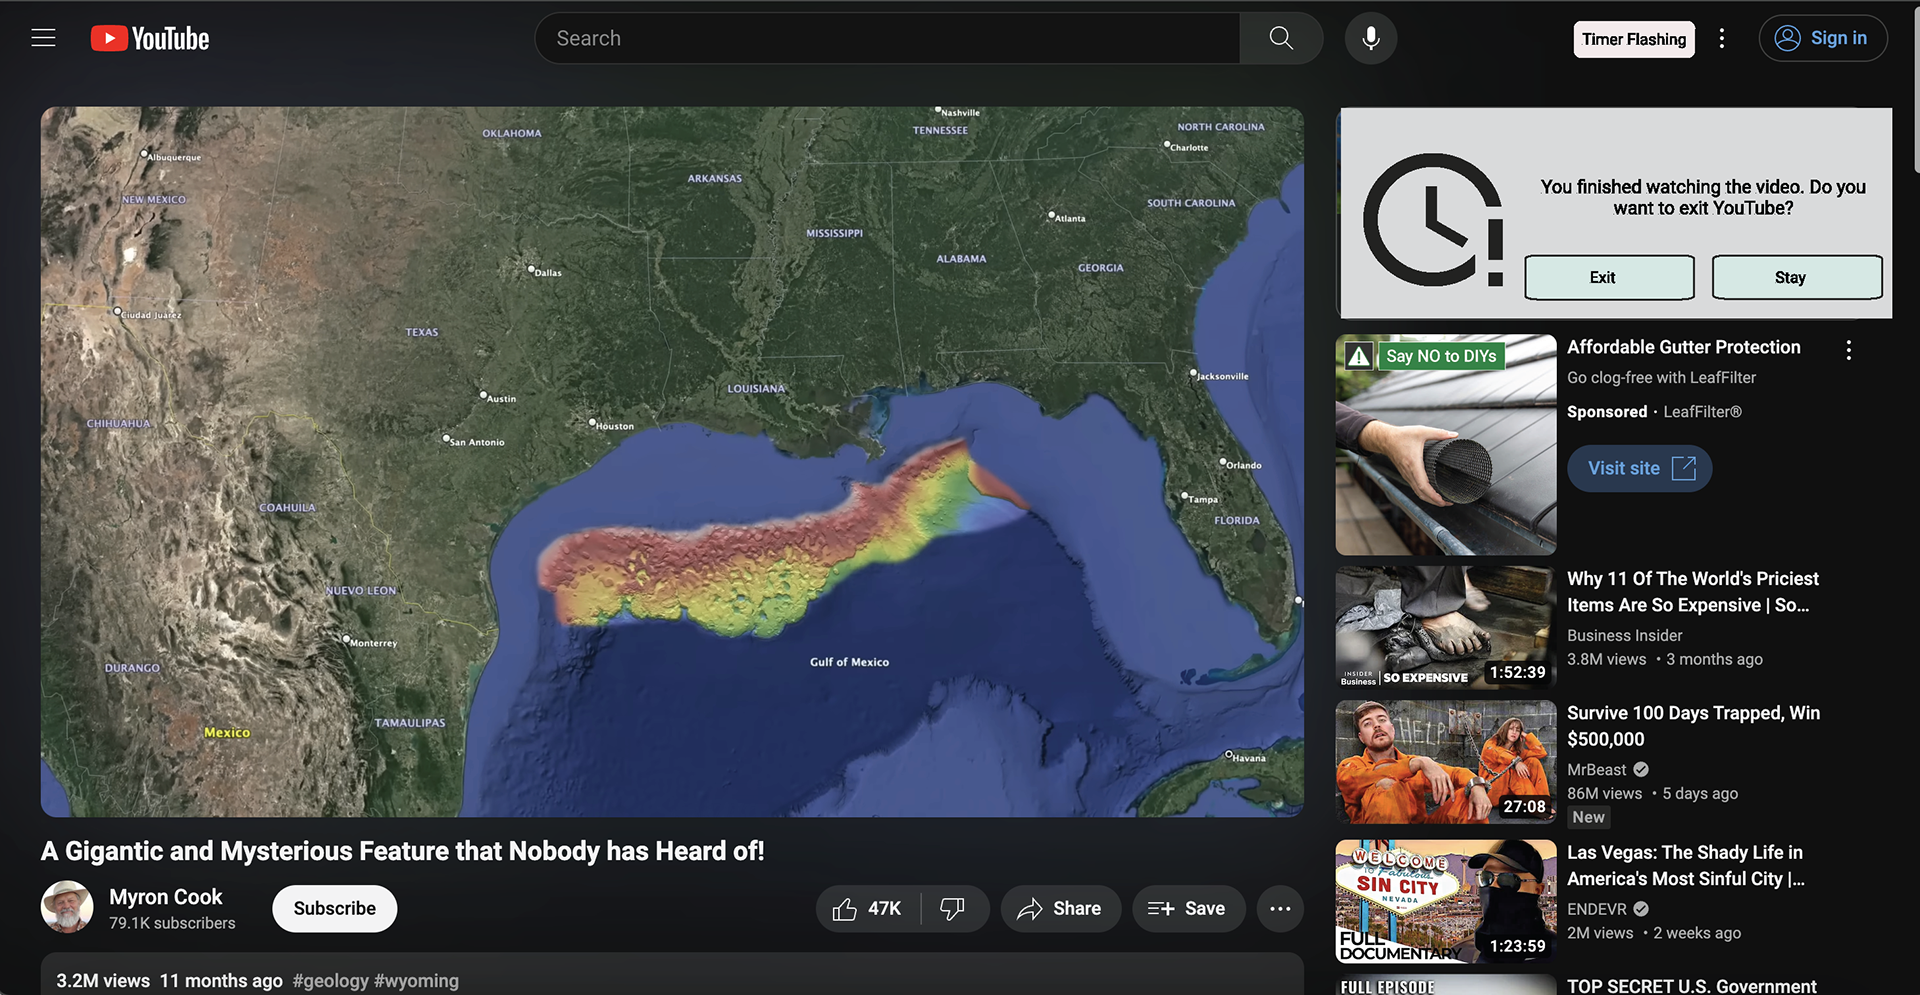
Location Sharing
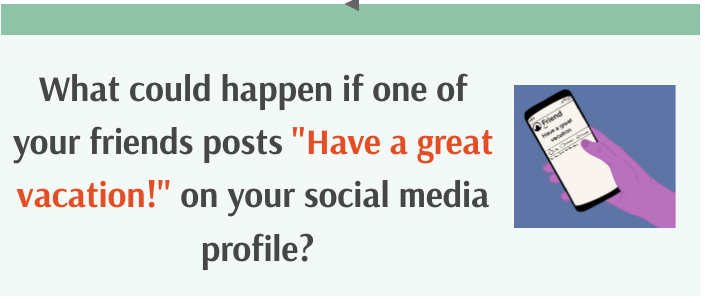
Information Sharing on Social Media
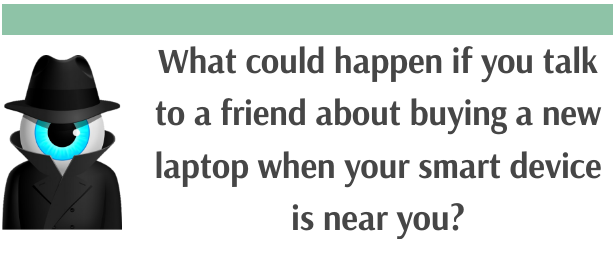
Tracking and Personalization
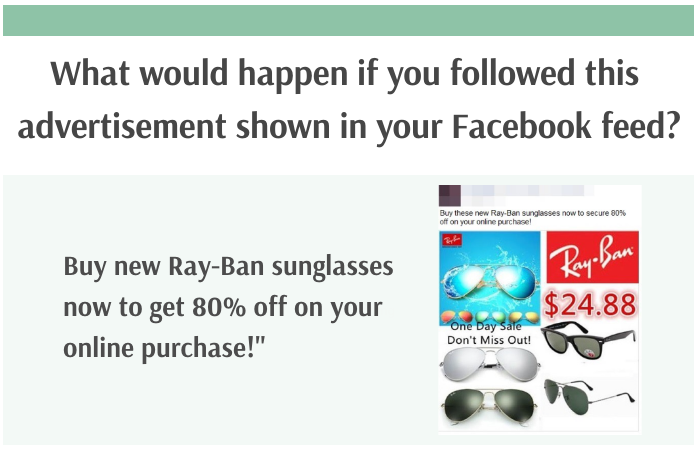
Online Transaction
This study takes a digital literacy approach to help older adults safely navigate online spaces. We developed 4 digital literacy module on Location Sharing, Information Sharing on Social Media, Online Transactions, and Tracking and Personalization. Each module was delivered in 4 different modalities: video, chatbot instructor, infographic, and comic. [Aly et al., 2022]
We evaluated the modalities to identify which best helps in developing privacy knowledge. I developed the infographics and conducted 2 focus group with 4 older adults in each to identify learning needs to address in the modalities. [Aly et al., 2024]
Personal Information Disclosure and Cyberbullying Incidents
We take an Action Research approach to learn about the roles of different stakeholders, types, and personal information in cyberbullying incidents. We conduct participatory action design study with high school students to develop mechanisms for prevention, support and awareness among cyberbullying victims, disclosers and attackers, with a focus on aspects of information disclosure.
Older Adults Experiences Seeking Romantic Relationship through Online Dating
We conducted a systematic literature review on the scholarship focusing on older adults’ use of dating apps
and other relevant platforms for pursuing romantic relationships.
and other relevant platforms for pursuing romantic relationships.
Participants Data Privacy in User Studies with LLMs